Essential Factors of An Ideal Project Data Analytics Dashboard
Having an ideal project data analytics dashboard helps an organization in keeping track of the needs and challenges of their projects. Project dashboards must offer real-time analytics for showing the health of a project to the project managers or project stakeholders. Hence, allowing them to make quick and informed decisions.

Project data analytics dashboards are composed of widgets such as charts, calculated indicators, histograms, sectors, etc. In a nutshell, project dashboards are a series of data, charts and gauges of the performance of your project. So how should an ideal project data analytics dashboard look like? It should be made as per the needs and challenges of your projects and overall. Moreover, an ideal dashboard needs to be customizable.
Let us have a look at some of the essential factors of an ideal project data analytics dashboard below:
Activity Tracker
An activity tracking widget helps in providing an overview of project-related activities, upcoming events, upcoming deadlines and more. It also determines the actions of individual team members or the involved teams.
Progress Reports and Status
The project reports and status widget enables people involved in the project to view the project progress, status, workloads, and budget. Moreover, you get real-time information about resource allocation.
Milestone Tracking Reports
Milestone tracking reports provide a global view of the milestone your project has reached and the milestones the project has to attain in the future. The milestones consist of a description, start and end dates, and the name of the person responsible for getting things done. It provides a clear and quick picture of where a project is in its life cycle.
Personal To-Do List
A personal to-do list widget is a checklist of the tasks accomplished and the tasks needed to be executed. It helps the concerned team members to be more productive by running one task at a time.

Task Status
Task status widget lies in between the activity tracker and the project progress widget. It provides a quick status of all the essential tasks of a project. While the activity tracker and project progress widget provide global information, the task status widget offers specific details on every task.
Team Workload Status
This widget provides information regarding the workload on the team by period and by tasks. It includes information such as assigned tasks, the due dates, the man-hours necessary and if the team is overloaded with work.
Resource Allocation
Somewhat similar to the team workload status, resource allocation widget provides a global overview of the resource commitments. It differs depending upon the criteria and indicators used for customizing it. It determines where, how and to what task the resources are allocated.

However, as already mentioned, an ideal project data analytics dashboard needs to be customizable depending upon the project’s tasks and challenges.
Conclusion:
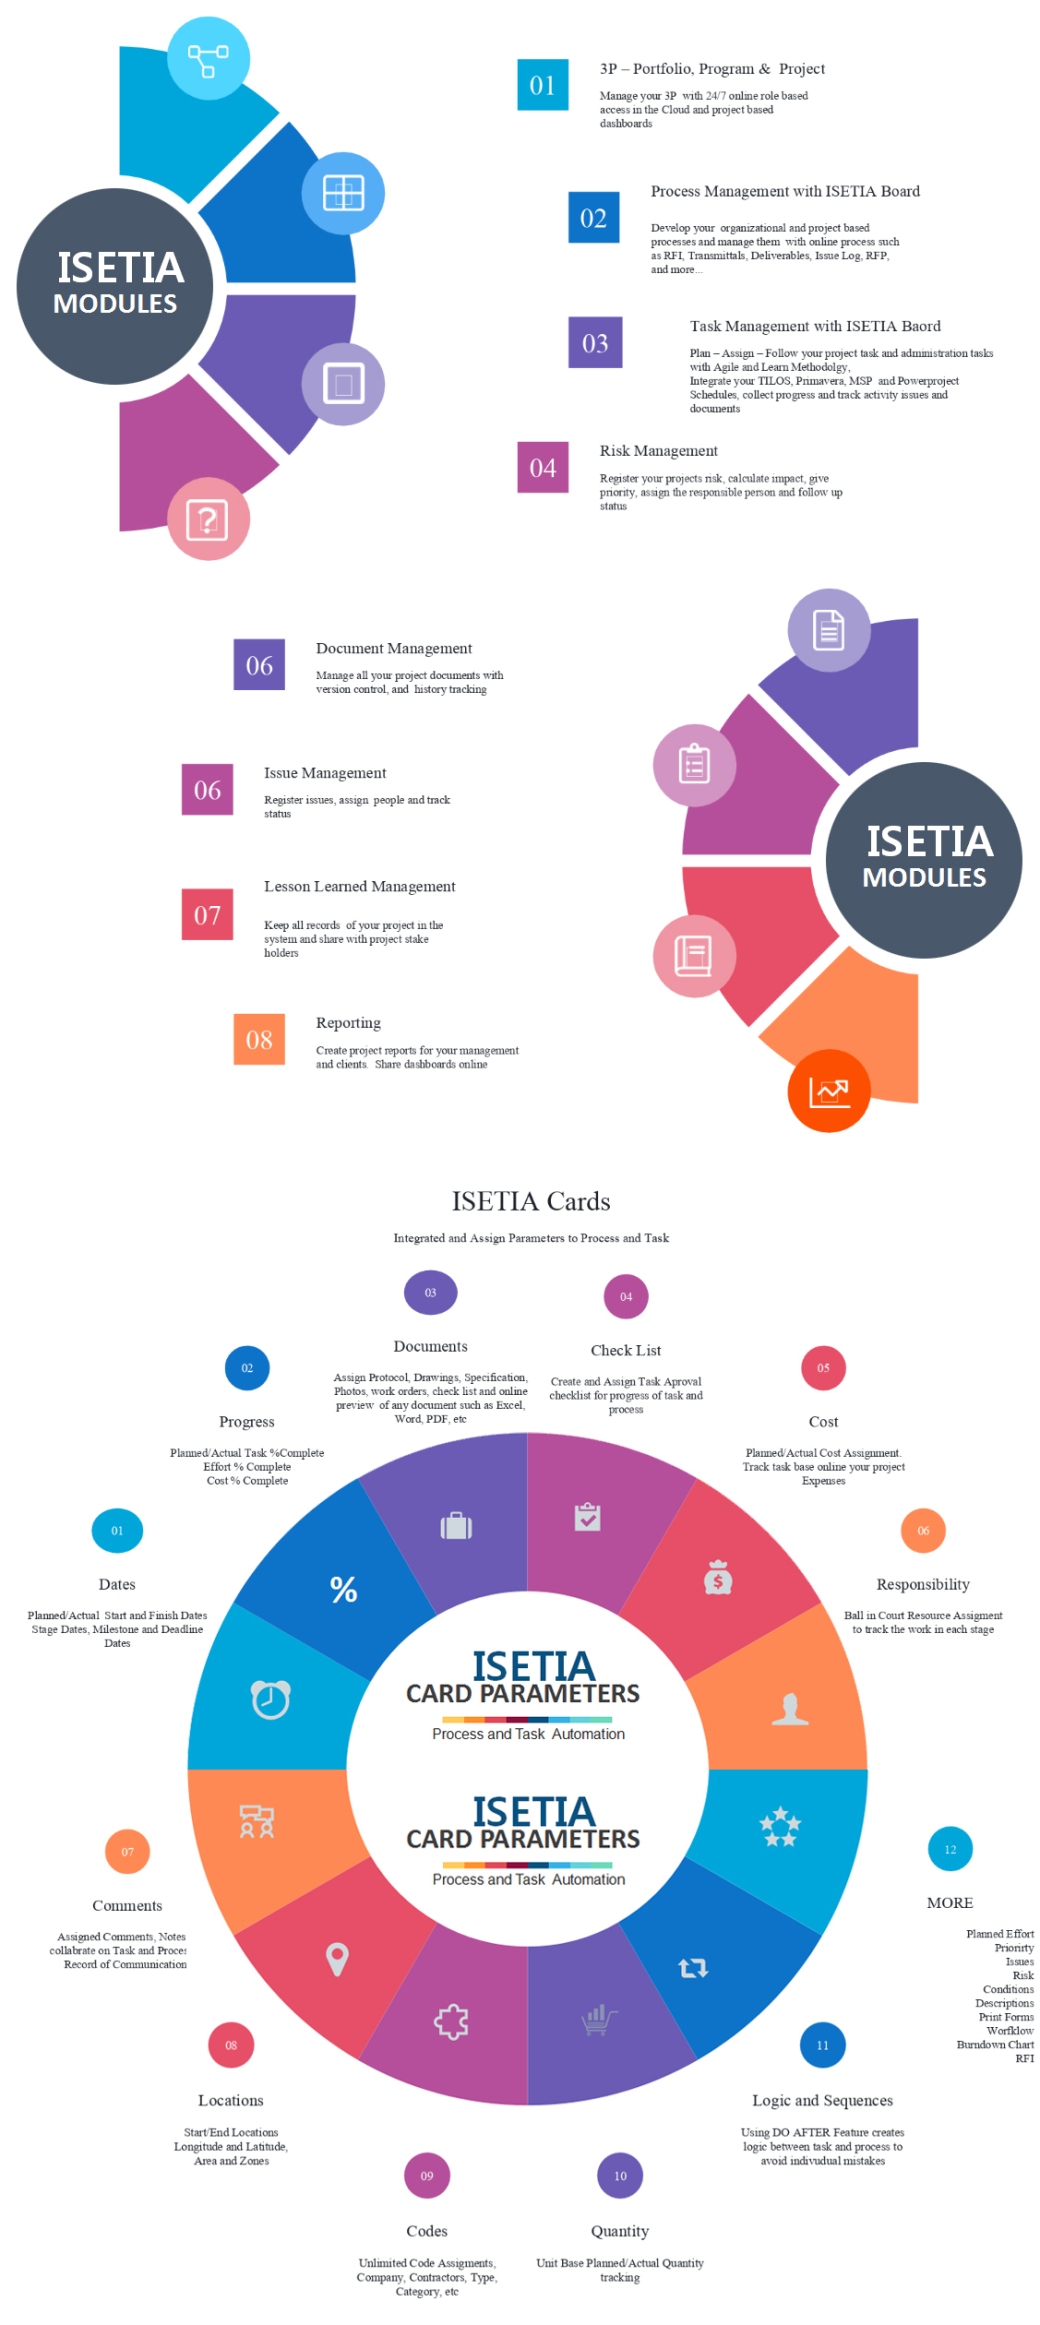
KL iTech provides ISETIA, a fully integrated project data analytics dashboard software that is fully adaptable and tailored to the needs of the customer. Call at +91 99406-68885 to discuss your requirements and have the best of project data analytics dashboard software .

